- TOP
- やる夫で学ぶGoogleAnalytics
- GoogleAnalyticsAPI自動レポートツールQuillEngage使ってみたお。
GoogleAnalyticsAPI自動レポートツールQuillEngage使ってみたお。
- 2014/03/19
- googleanalytics
https://quillengage.narrativescience.com/
QuillEngageを使ってみた。
Google アナリティクスのデータからレポートを自動生成するツール。指定メールアドレスに対し週次・月次で
レポートを送ってくれるわけね。
で、下記がそのメール内容
単純なトラフィックの推移だけでなく、どの流入経路が何%上がったか、
といった、いわゆる「分析」までざっくりとしてくれお。
Paid Search 有料広告
Traffic Sources 流入経路
New Referrals 新規の外部サイト
基本だけど、抑えるべきところを網羅してるね。
これ日本語版あれば何気につかえるなー。
↓メール詳細————————
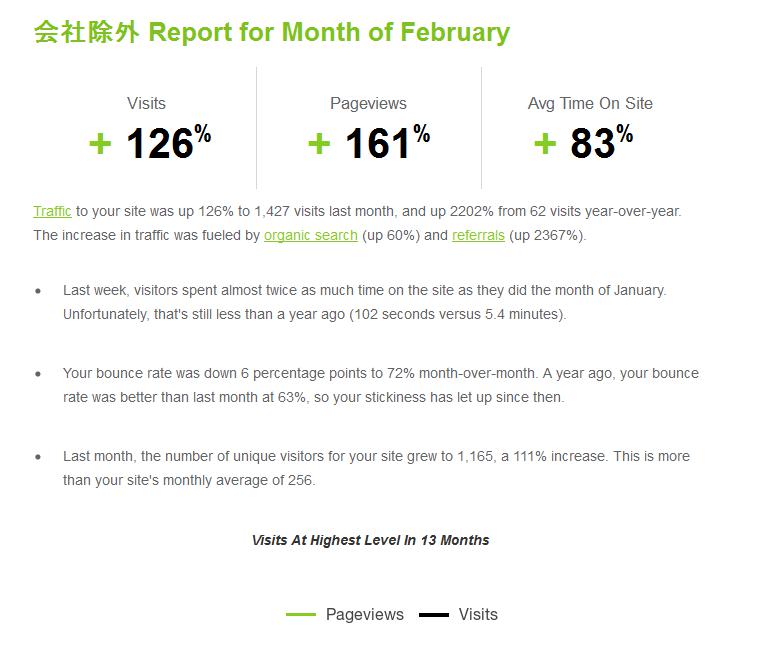
会社除外 Report for Month of February
Visits
+ 126%
Pageviews
+ 161%
Avg Time On Site
+ 83%
Traffic to your site was up 126% to 1,427 visits last month, and up 2202% from 62 visits year-over-year. The increase in traffic was fueled by organic search (up 60%) and referrals (up 2367%).
Last week, visitors spent almost twice as much time on the site as they did the month of January. Unfortunately, that’s still less than a year ago (102 seconds versus 5.4 minutes).
Your bounce rate was down 6 percentage points to 72% month-over-month. A year ago, your bounce rate was better than last month at 63%, so your stickiness has let up since then.
Last month, the number of unique visitors for your site grew to 1,165, a 111% increase. This is more than your site’s monthly average of 256.
Visits At Highest Level In 13 Months
Paid Search
It looks like you don’t have paid search data for your site yet. You can learn more about Google AdWords here.
Traffic Sources
Organic search traffic was up to 856 visits from 534 the month prior, and accounted for 60% of site traffic overall. Direct visits were up to 273 from 85 last month and accounted for 19% of your site’s total traffic. Compared to a month earlier, direct traffic made up 13% of total visits.
Facebook was once again your top referral in terms of social traffic. The number of visits coming from the site rose 6025% from one month before to 245. However, visitors from Facebook were less engaged than your average social visitor as measured by time on site, bounce rate and pages per visit.
New Referrals
b.hatena.ne.jp and netvibes.com were the new referrers that drove the most traffic last month with 4 visits and 3 visits, respectively.
These are the new links that started sending you traffic last month for the first time this year.
Referral Visits Avg Time On Site
b.hatena.ne.jp 4 2 seconds
netvibes.com 3 0 seconds
*Note that for referral visits with an average time on site of zero, there was likely only one pageview, so Google Analytics was unable to calculate an average visit duration.
Audience Segments
New vs. Returning Visitors
Although new visits rose to 1,123, they accounted for a smaller proportion of total visits (79%). New visitors spent about two minutes less on the site than returning visitors last week. This could indicate that your new visitors didn’t find the information they needed or came to the site expecting something else.
Mobile
Mobile traffic was up 2500% with 26 visits, accounting for 2% of all traffic. Typically your site’s mobile and desktop traffic look the same, but engagement was better for mobile users last month. Mobile’s 27% bounce rate was better than desktop’s 73%.
Locations
Japan was the country with the largest number of visits again last month (1,304), up 130%. Tokyo was the region that helped drive traffic with a 131% increase to 873 visits. Shibuya dropped out of the top five cities by visits last month moving from fifth to ninth.
Your Google Analyt
—————————–
最新記事
-

【超便利!】googleアナリティクスとグーグルスプレッドシートの連携機能のまとめをまとめてみた 2018/10/25
-

アナリティクス業界の巨人・運営堂さんと俺の焼肉 2017/10/27
-

ページスクロール率を計測しよう(GTM編) 2017/07/28
-

【速報】Google Optimize(グーグルオプティマイズ)がやっと利用できるようになった 2017/03/22
-
![[どっちが人気?]欅坂46と乃木坂46の人気を分析してみた。](data:image/png;base64,iVBORw0KGgoAAAANSUhEUgAAAWgAAADIAQMAAAD/QOnMAAAABlBMVEUAAAD///+l2Z/dAAAAAXRSTlMAQObYZgAAAAlwSFlzAAAOxAAADsQBlSsOGwAAACBJREFUaN7twQENAAAAwqD3T20ON6AAAAAAAAAAAIAXAyPwAAESgDEbAAAAAElFTkSuQmCC)
[どっちが人気?]欅坂46と乃木坂46の人気を分析してみた。 2017/03/09
- ABテストツール…(2)
- GAで使える記事・サイト…(7)
- Google AdSense(グーグルアドセンス)…(2)
- GoogleAnalytics機能・仕様…(28)
- SEO関連…(3)
- wordpress…(3)
- wordpress(ワードプレス)関連…(1)
- アクセス解析のよくある質問…(2)
- アクセス解析の分析手法…(6)
- アクセス解析指標の定義…(5)
- ショッピングカート関連…(1)
- ソーシャル関連ツール…(0)
- タグマネージャー…(9)
- マーケティングデータ収集ツール各種…(1)
- ユニバーサルアナリティクス関連…(4)
- ランディングページ分析ツール…(0)
- リスティング広告関連…(7)
- 接客ツール…(0)
- 改善アイデア…(1)


